
Simple Example on Jupyter
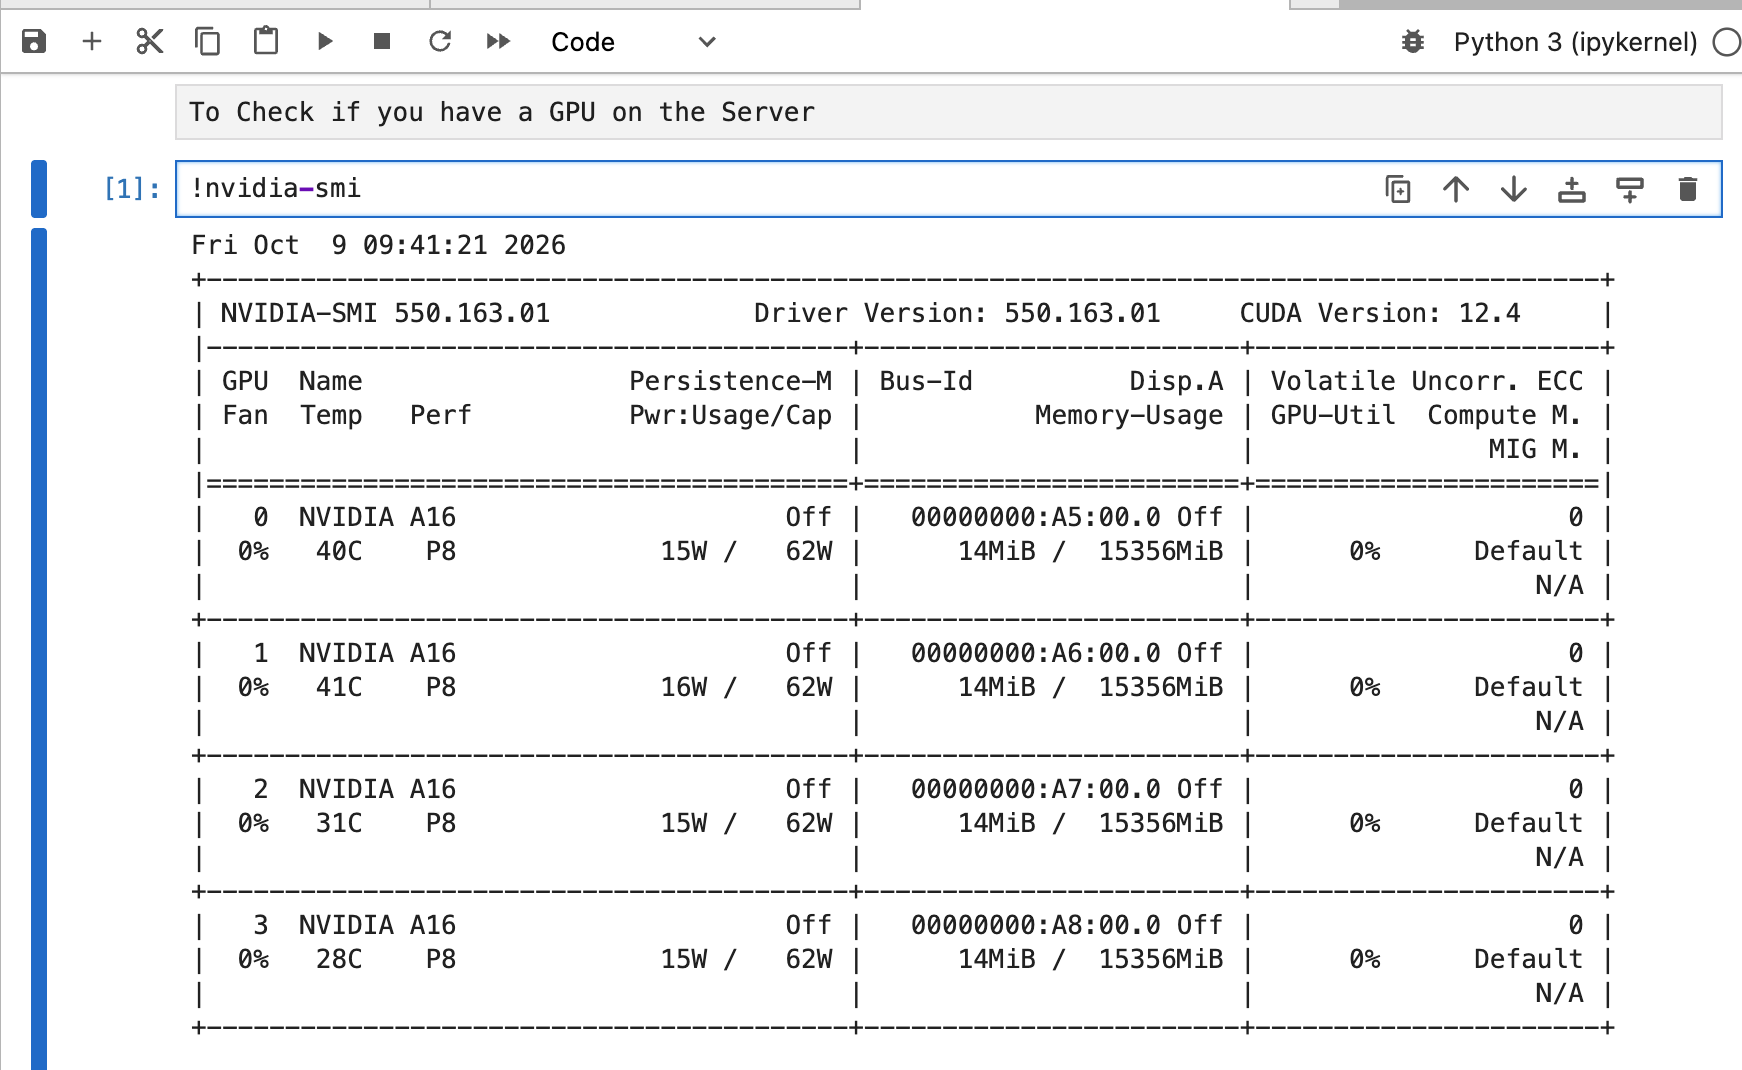
How to Check if you have a GPU on the Server
Installing a library
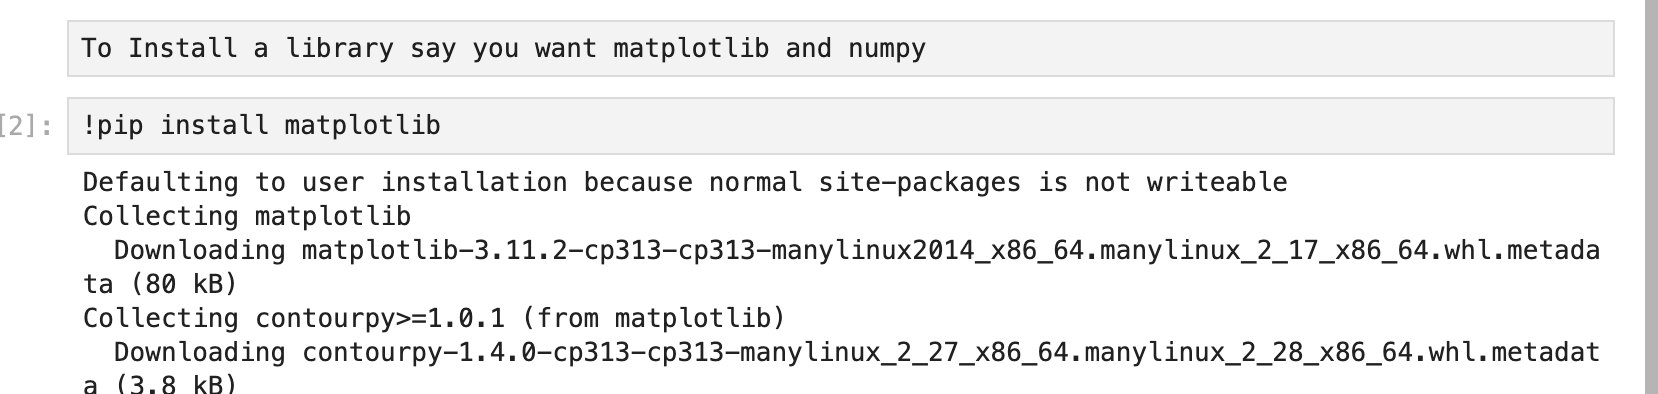
Matplotlib installs numpy as it is a dependency
Test
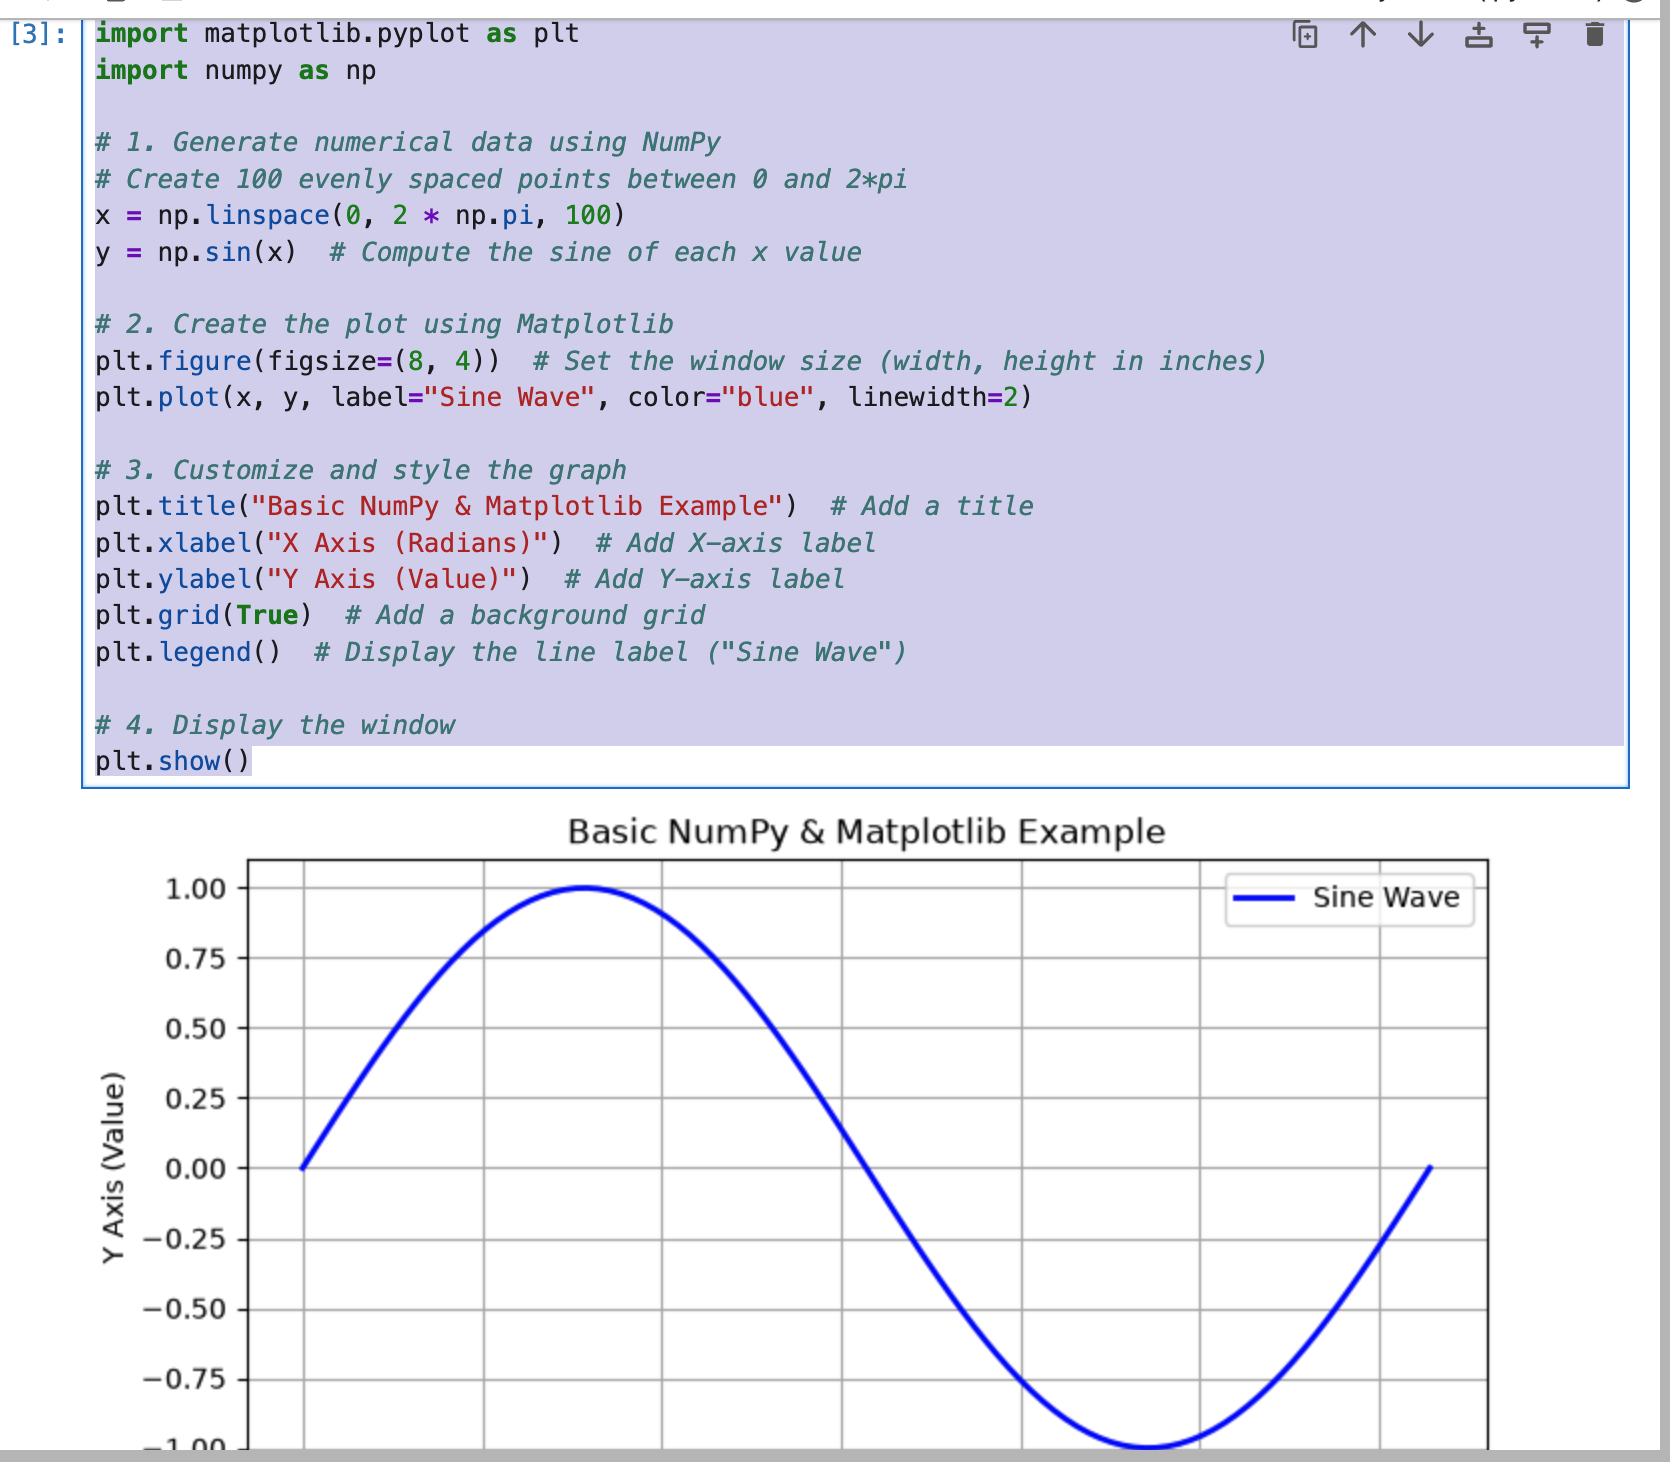
import matplotlib.pyplot as plt
import numpy as np

# 1. Generate numerical data using NumPy
# Create 100 evenly spaced points between 0 and 2*pi
x = np.linspace(0, 2 * np.pi, 100)
y = np.sin(x)  # Compute the sine of each x value

# 2. Create the plot using Matplotlib
plt.figure(figsize=(8, 4))  # Set the window size (width, height in inches)
plt.plot(x, y, label="Sine Wave", color="blue", linewidth=2)

# 3. Customize and style the graph
plt.title("Basic NumPy & Matplotlib Example")  # Add a title
plt.xlabel("X Axis (Radians)")  # Add X-axis label
plt.ylabel("Y Axis (Value)")  # Add Y-axis label
plt.grid(True)  # Add a background grid
plt.legend()  # Display the line label ("Sine Wave")

# 4. Display the window
plt.show()